1. Next to the map, click on any type of crime that you are interested in, then move the bar under year from left to middle and to right. Do you recognize any trend? What are some explanation?
2. Pick any type of crime that you are interested in, where does this crime happen the most in the city? Compare the same crime over 3 years, which part of the city has significantly decrease/increase?
3. Take a look at the bar graph, what are the few popular crimes in Chicago? How do they change over the years?
4. Imaging you are a tourist, which crime do you think it’s mostly related to gang activity? Explore how that crime changes over the years on the map and decide which part of the city you want to avoid staying.
1. The trend for the specific crime that I had looked at was showing a trend of decrease from year to year. It could be that particular crime was more carefully patrolled by the city to decrease this specific crime.
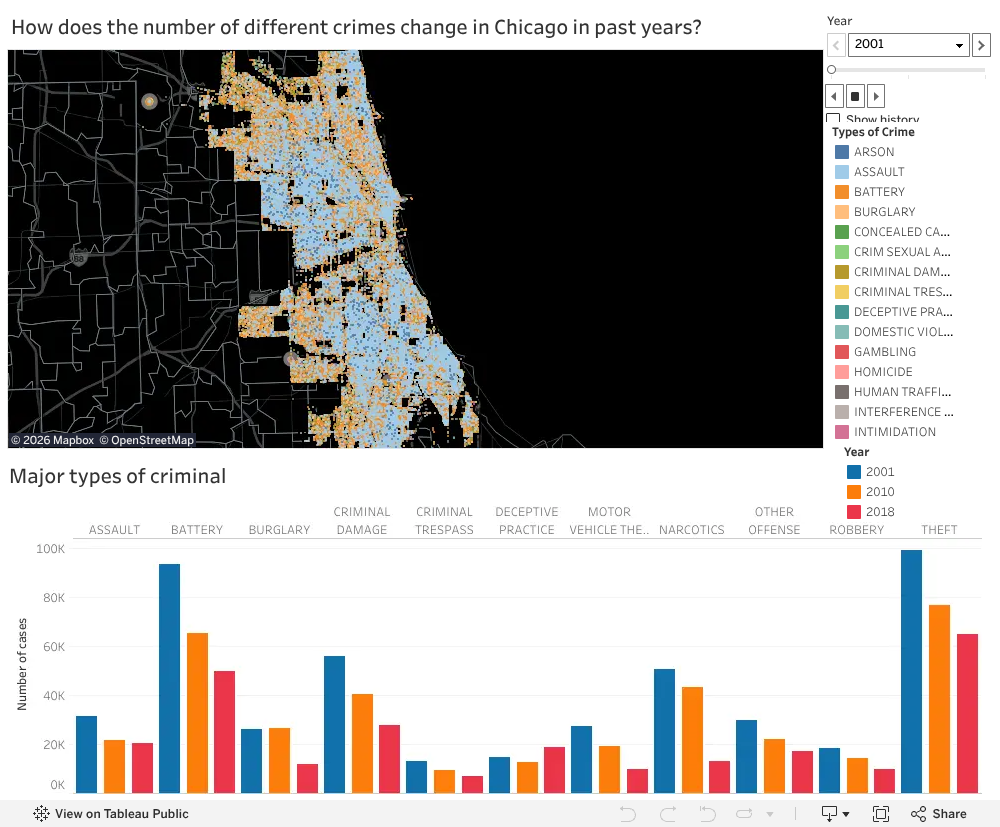
2. Theft, it happens all over the city. It looks like the south side of the city has increase over the year.
3. Theft, battery, and criminal damage. All three are showing a decreasing trend over the years.
4. I believe battery is highly related to gang activity. They are happening on all parts of the map, but highly concentrated around the northern part of the city. Hence, if I was a tourist, I would avoid that part of town at all possible cause.
Our visualization composes with two main parts. The first part is an interactive map plotted with the location of different types of crime recorded in Chicago in 2001, 2010, and 2018. To answer our question, “How does the number of different crimes change in Chicago in past years?”, the users can click on each type of crimes that they want to explore. Then, they can move the bar above to switch to different year to see how does the number and location changes between 2001, 2010 and 2018. The second part is a bar graph consists of crimes that have recorded for more 5,000 cases in 2001, 2010, 2018. This gives readers a chance to see how all the major crimes changes overtime at once.
1. Next to the map, click on any type of crime that you are interested in, then move the bar under year from left to middle and to right. Do you recognize any trend? What are some explanation?
ReplyDelete2. Pick any type of crime that you are interested in, where does this crime happen the most in the city? Compare the same crime over 3 years, which part of the city has significantly decrease/increase?
3. Take a look at the bar graph, what are the few popular crimes in Chicago? How do they change over the years?
4. Imaging you are a tourist, which crime do you think it’s mostly related to gang activity? Explore how that crime changes over the years on the map and decide which part of the city you want to avoid staying.
1. The trend for the specific crime that I had looked at was showing a trend of decrease from year to year. It could be that particular crime was more carefully patrolled by the city to decrease this specific crime.
Delete2. Theft, it happens all over the city. It looks like the south side of the city has increase over the year.
3. Theft, battery, and criminal damage. All three are showing a decreasing trend over the years.
4. I believe battery is highly related to gang activity. They are happening on all parts of the map, but highly concentrated around the northern part of the city. Hence, if I was a tourist, I would avoid that part of town at all possible cause.
Our visualization composes with two main parts. The first part is an interactive map plotted with the location of different types of crime recorded in Chicago in 2001, 2010, and 2018. To answer our question, “How does the number of different crimes change in Chicago in past years?”, the users can click on each type of crimes that they want to explore. Then, they can move the bar above to switch to different year to see how does the number and location changes between 2001, 2010 and 2018. The second part is a bar graph consists of crimes that have recorded for more 5,000 cases in 2001, 2010, 2018. This gives readers a chance to see how all the major crimes changes overtime at once.
ReplyDeleteThis comment has been removed by the author.
ReplyDelete